Monitoring your Spring application using Dropwizard metrics module
Yes, it’s true, that Spring is better, than Dropwizard. I’ve worked with both frameworks, and can truly say, that Dropwizard has poor Guice dependency injection, Jersey, which I don’t like at all, and other things. But there’s one thing, which I like in Dropwizard, and which I’d be happy to see in Spring Framework - Dropwizard Metrics module. it has very rich number of instruments, which can help you to understand your application behaviour: different gauges, timers, counters, histograms, timers, and healthcheks.
The question is how to import Dropwizard Metrics into Spring?
Basically, you need to add 3 dependencies:one as an adapter for dropwizard metrics, another is for jvm metrics and last one for Filter, which you will use to get this metrics using http.
Depending on what build tool you have in your application - include those libraries. I use Gradle, so my build.gradle looks like following:
Create Metrics Listener
One thing you need to know about Dropwizard Metrics module is that it’s required to have MetricRegistry and HealthCheckRegistry classes to be instantiated under ServletContext. That’s why we’ll get it from constructor, and initialise context.
We will create a separate bean for this listener soon.
Creating configuration class
Now, when you have everything ready to launch your metrics, you need to inject it somewhere. I propose to do a separate configuration class for that. Let’s call it MonitoringConfiguration
I bet, you’ve noticed couple of things:
-
@EnableMetricsannotation. Yes, you need to add it, don’t forget. -
MetricsServletContextListener initialisation. I don’t have web.xml descriptor anymore in my app, so the true way to do it is by injecting it in spring context. Spring will take care of it.
-
Extending from MetricsConfigurerAdapter. This class comes from com.ryantenney.metrics:metrics-spring:3.1.2 dependency
-
Implemented configureReporters method. By this method we decide what to do with our metrics. Later, in this article, I’ll show you how to poll this metrics to some UI tools, which will visualise our results.
Tune your controller methods
If you want to monitor your endpoints, you need to add additional annotations to them. Add @Timed and @ExceptionMetered annotations. @Timed will take all the measures, while @ExceptionMetered will measure all exceptional situations with your endpoint.
That’s it
Now, you are ready to access your application on http://localhost:8080/dropwizard/metrics:
See how more descriptive it is, comparing to what ‘metrics’ we have in Spring.
AdminServlet has another bunch of endpoints, which you can use:
- /healthcheck: HealthCheckServlet
- /metrics: MetricsServlet
- /ping: PingServlet
- /threads: ThreadDumpServlet
Spring power together with Dropwizard metrics
Now as we have Spring here, we have the power of doing different BeanFactoryPostProcessor’s for new metrics. It’s much more easy, than doing it in Guice DI, which comes with Dropwizard.
Visualising metrics
We can use Graphite for that. Here’s how you can install it on mac. For other OS’s, find appropriate instuctions somewhere.

Add additional dependency:
Then, modify our configuration class for that:
application.properties:
Give some load to your endpoints
Start your Spring application, turn on Graphite on your local machine, and give some load to some of your endpoints. I prefer to do it using load tests.
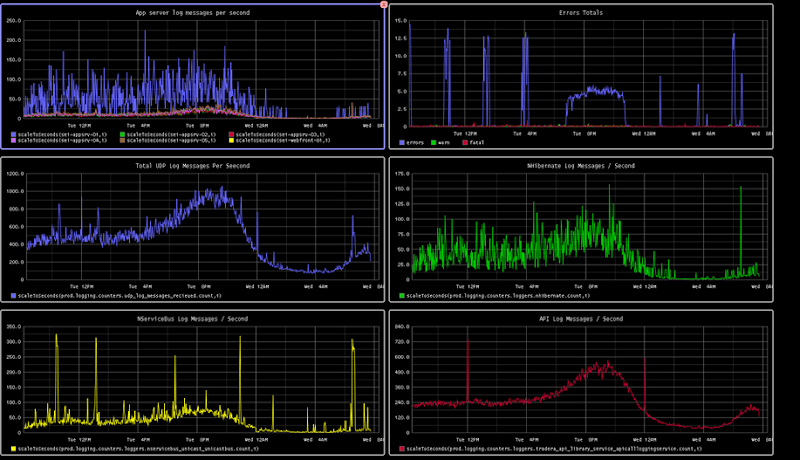
After some load, you can see, how your application behaves: I showed m1,m5 and m15 rates.

As you can see, you’re now able to get more information from your application. The information you have now is much more descriptive, than you had before. I usually speak with my colleagues from different company and ask how they measure and monitor their application activity. Most of the people answer, that they sent their logs somewhere and in case of incidents, they ask their devops to get information about their app. It’s a big limitation, and I think each developer should have access to metrics dashboard.


