Detecting memory leaks using JVisualVM and Memory Analyzer Tool
Few days ago I had a problem on one of the projects that I am working on, we had a memory leak. During the two days period our services crashed three times, so I decided to investigate it. Everything which I’m going to talk about is not a rocket science, there’s no clever and tricky tips, it’s just a straighforward explanation how you can find memory leaks.
Exposing JMX
I had a problem on a production instance, so I started my services with JMX feature enabled. Just start your apps with following params:
    -Djavax.management.builder.initial=
    -Dcom.sun.management.jmxremote
    -Dcom.sun.management.jmxremote.port=${whatever_port}
    -Dcom.sun.management.jmxremote.authenticate=false
    -Dcom.sun.management.jmxremote.ssl=false
Starting JVisualVM
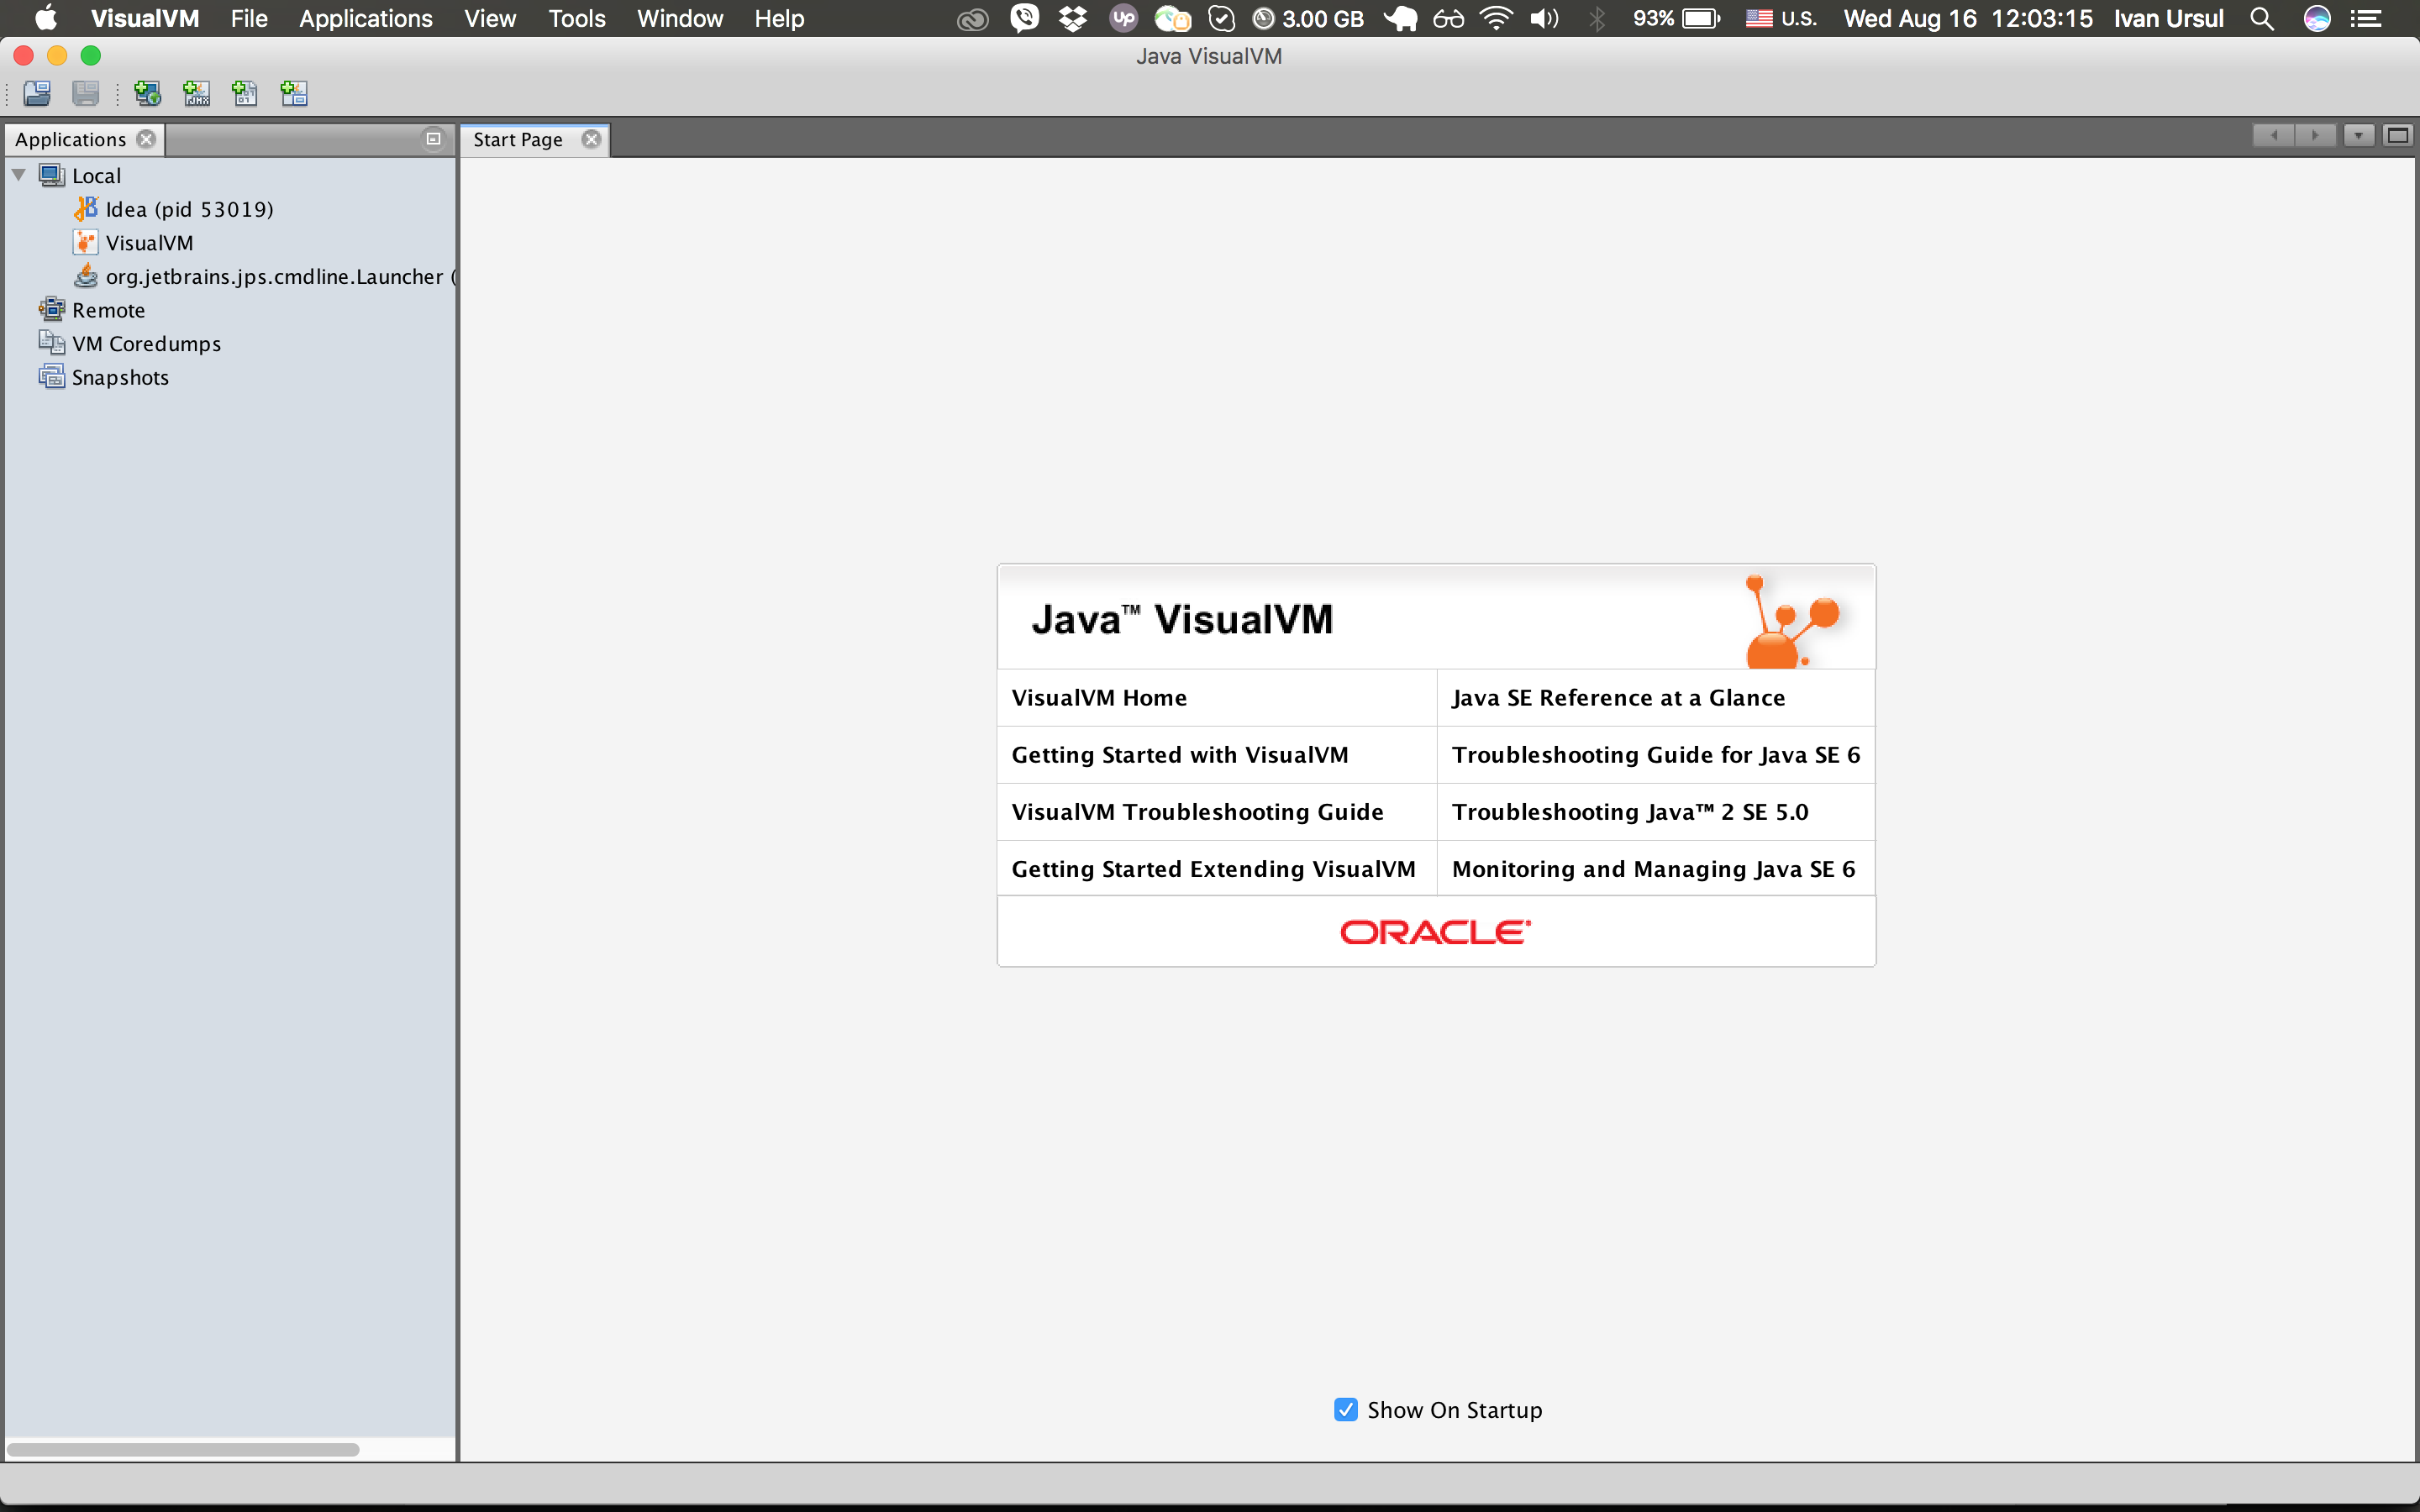
Just enter your terminal and type jvisualvm.
You should get following screen:

Add a remote connection, specify JMX port and connect.
Waiting
You have to wait some time before retained memory will take place and you will be able to analyse it. It’s up to you how long to wait, in my case, it was enough to wait 4-5 hours to get 100% proof of what part of the system is leaking.
Getting heap dump
Now go to Monitor section, press Heap Dump button and specify path where heap dump should be saved. In my case it was /tmp/**.hproof.
Then copy it from remote server to your local pc.
Memory Analyzer
Go to Eclipse MAT site and download latest version. Once it’s downloaded, unzip and launch it.
Then open heap dump, specify that you want to analyse it for memory leaks and that’s it. Wait for one minute and see the results.
Results
In my case, it was a class, which contained a queue, which, for some reasons, couldn’t poll elements, because of third party exceptions.
You should get following screen:


